Tel: 01564 330336
FactoryWiz :: Large Screen Displays


Visual Manufacturing
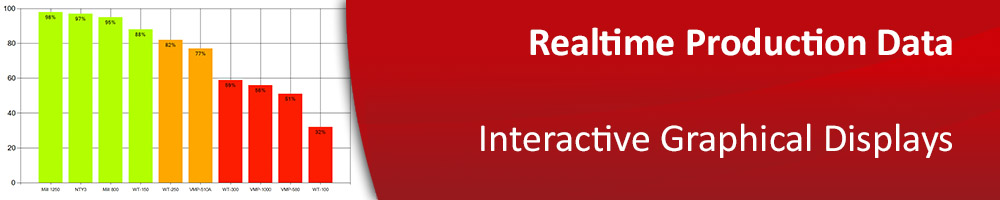
FactoryWiz includes our large screen display software: Productivity Monitor. This displays live realtime machine OEE data on a big screen. It is an interactive graphical system, click on a bar chart or timeline to drill down further into the data.
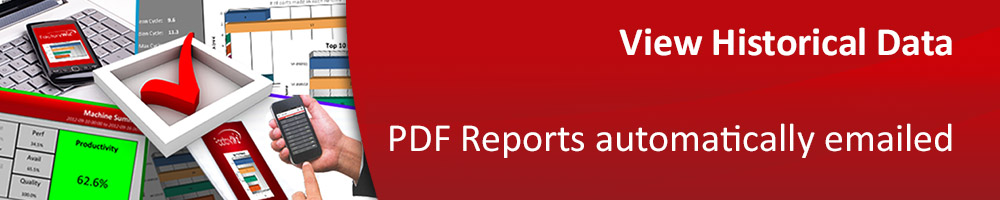
Productivity Monitor is a windows application and can also be installed on any employees PC or Laptop, to view historical data.

Main View - Live OEE Scores
This display shows the current OEE score for either all machines or a cell of machines. The time frame can be current day or shifts. The colour banding can be configured by the user.
Click on a bar to drive further into the data.

OEE Breakdown - Live Metrics
Our OEE formula is Performance x Availability x Quality
Click on a bar to drive further into the data.

Performance View
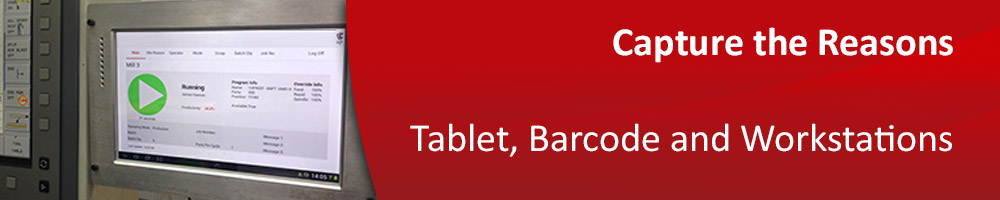
Seeing where you are losing money is key, stopping it happening before its too late is a big part of this. Here we have what the machine is currently doing, a timeline of what is has done and a table of non productive reasons.
Click on the timeline to see exactly what is happening..

Quality Display
See where you are in terms of output and rejected or defective parts.
Click on the timeline to see exactly what is happening..

Interactive Timeline of Events
This is a timeline of the days events for either all machines or a cell of machines. Click on events to show full details of that event. Zoom in on the data. Click at the end of the bar for accumulative display of the days data (OEE, setups, parts produced). Colours can be configured by the user based on CNC status and production mode (Production / Setup / Inspection).
Click on the timeline to see exactly what is happening..


